
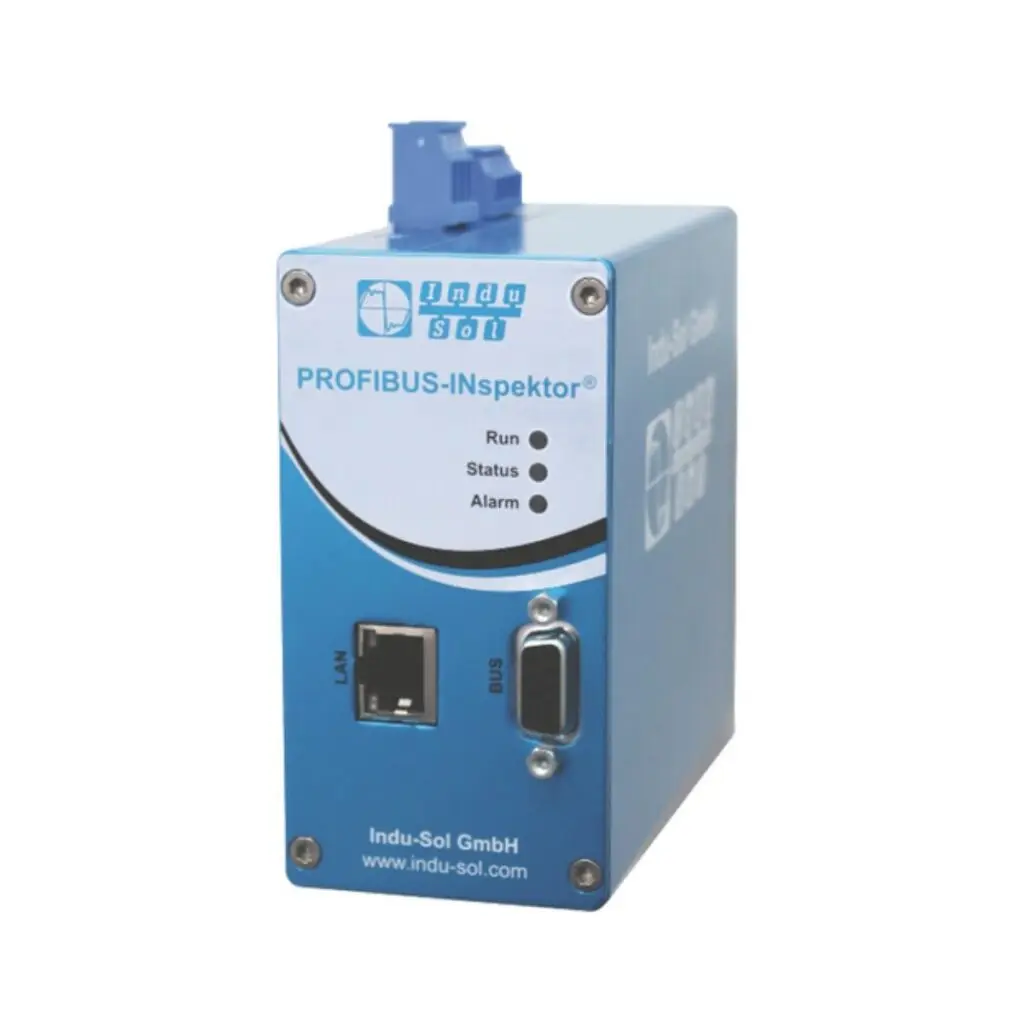
PROFIBUS-INspektor® NT
Passive PROFIBUS monitoring and diagnostic device for continuous analysis of network traffic, early fault detection, topology monitoring and preventative maintenance.
Product Overview
The PROFIBUS-INspektor® NT is a compact passive monitoring and diagnostic device for PROFIBUS networks. It continuously analyses logical PROFIBUS data traffic and records quality-relevant events, allowing developing communication problems to be identified before they result in network or production failures.
The device monitors events such as error telegrams, telegram repetitions, device failures, device diagnostic messages, restarts and bus cycle times. An integrated web interface provides access to the current network status as well as historical event data without requiring additional software.
The PROFIBUS-INspektor® NT can also display the network topology and the status of individual PROFIBUS nodes, helping maintenance and commissioning personnel localise potential weak points. Configurable thresholds can trigger alarms through the device’s LED, switching contact, email or SNMP trap functions.
The device can be used as a temporary diagnostic tool for commissioning and service work or as a permanently installed network monitor for preventative maintenance.
Key Features
• Passive, continuous monitoring of PROFIBUS communication
• Analyses logical PROFIBUS data traffic
• Detects error telegrams
• Detects telegram repetitions
• Detects device failures and restarts
• Records device diagnostic information
• Monitors bus cycle times and bus speed
• Integrated event history and network status overview
• Integrated PROFIBUS topology display
• Displays current and historical device status
• Configurable alarm thresholds
• Alarm indication via LED
• Alarm output via potential-free switching contact
• Email alarm notification
• SNMP trap notification
• Stores up to 2,000 alarm messages
• Each alarm can include a telegram snapshot
• Integrated web interface accessible through a standard browser
• No additional software required to access the web interface
• Suitable for commissioning and acceptance testing
• Suitable for service and troubleshooting
• Suitable for permanent network monitoring
Technical Specifications
Product Type: PROFIBUS monitoring and diagnostic device
Supported PROFIBUS Protocols: DP, DPV1, DPV2, FMS and MPI
PROFIBUS Connection: 9-pole Sub-D
PROFIBUS Baud Rate: 9.6 kbit/s to 12 Mbit/s
Ethernet Connection: RJ45
Ethernet Data Rate: 10/100 Mbit/s
Power Supply: +24 V DC ±10%
Current Consumption: 0.2 A
Monitoring Method: Passive data collection
Monitored Events: Error telegrams, telegram repetitions, device diagnostics, device failures, restarts, bus cycle times and bus speed
Alarm Memory: Up to 2,000 alarm messages
Telegram Snapshot: Up to 500 PROFIBUS telegrams per alarm
Alarm Outputs: LED, potential-free switching contact, email and SNMP trap
Topology: PROFIBUS topology display with device status
Web Interface: Integrated web interface accessible through a standard web browser
Installation: 35 mm DIN rail
Dimensions: 105 × 54 × 124 mm (H × W × D)
Protection Class: IP20
Operating Temperature: +5 °C to +55 °C
Article Number: 124010020